California Fast Food Minimum Wage Mandate, Impact in Fresno County — What the Data Tells Us
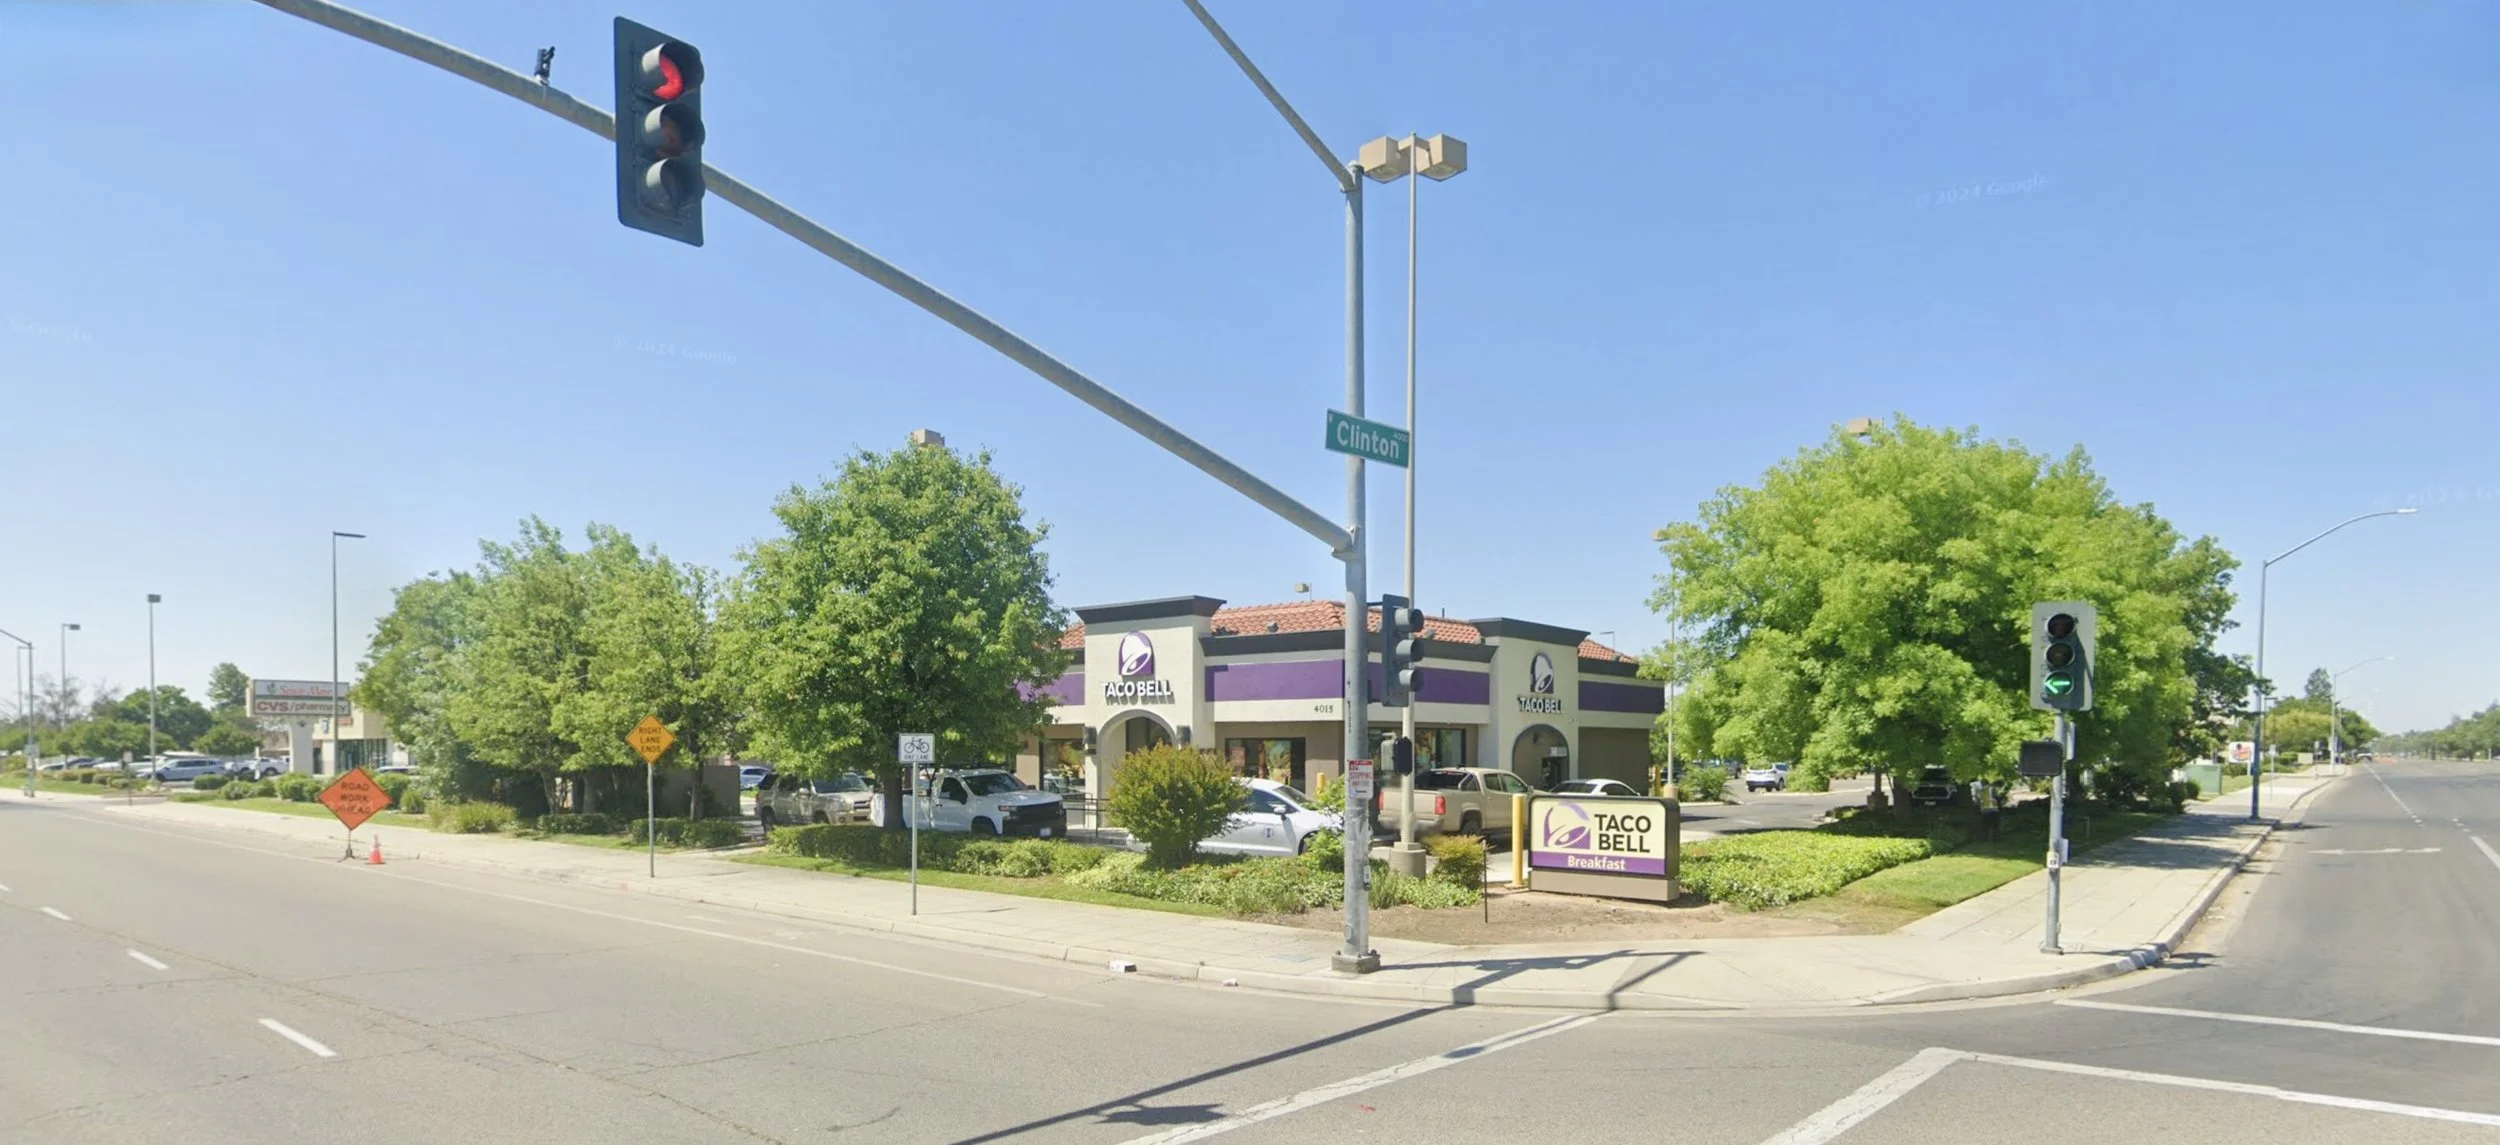
Taco Bell at the intersection of Clinton & Brawley Avenues in West Fresno
Background
Back on April 1st, 2024, the State of California instituted a new law (AB 1228) raising the minimum wage for fast food workers to $20 per hour — marking a 25% increase from the state’s then blanket minimum wage of $16, which went into effect January 1st of that year. What constitutes a “fast food” establishment is generally covered under the NAICS code 733513: limited-service restaurants. These are restaurants that offer no table service, where customers order food and beverages that are paid for prior to consumption, whether it be dine-in, take-out, or delivery. For an establishment to be subject to this law, it must be part of a restaurant chain with at least 60 locations nationwide.
A study published by the National Bureau of Economic Research found that employment in the fast food sector declined by 18,000 between September 2023 (when the law was first enacted) and September 2024. Relative to the United States overall, this represents a 2.7 percent decline. When I first read this headline, I was immediately curious what these figures might look like for Fresno County. So I began the process of collecting historical QCEW data as far back as Q3 2021. This window gives us at least two years of pre-mandate data to compare with, while also remaining safely outside of any covid-era restrictions.
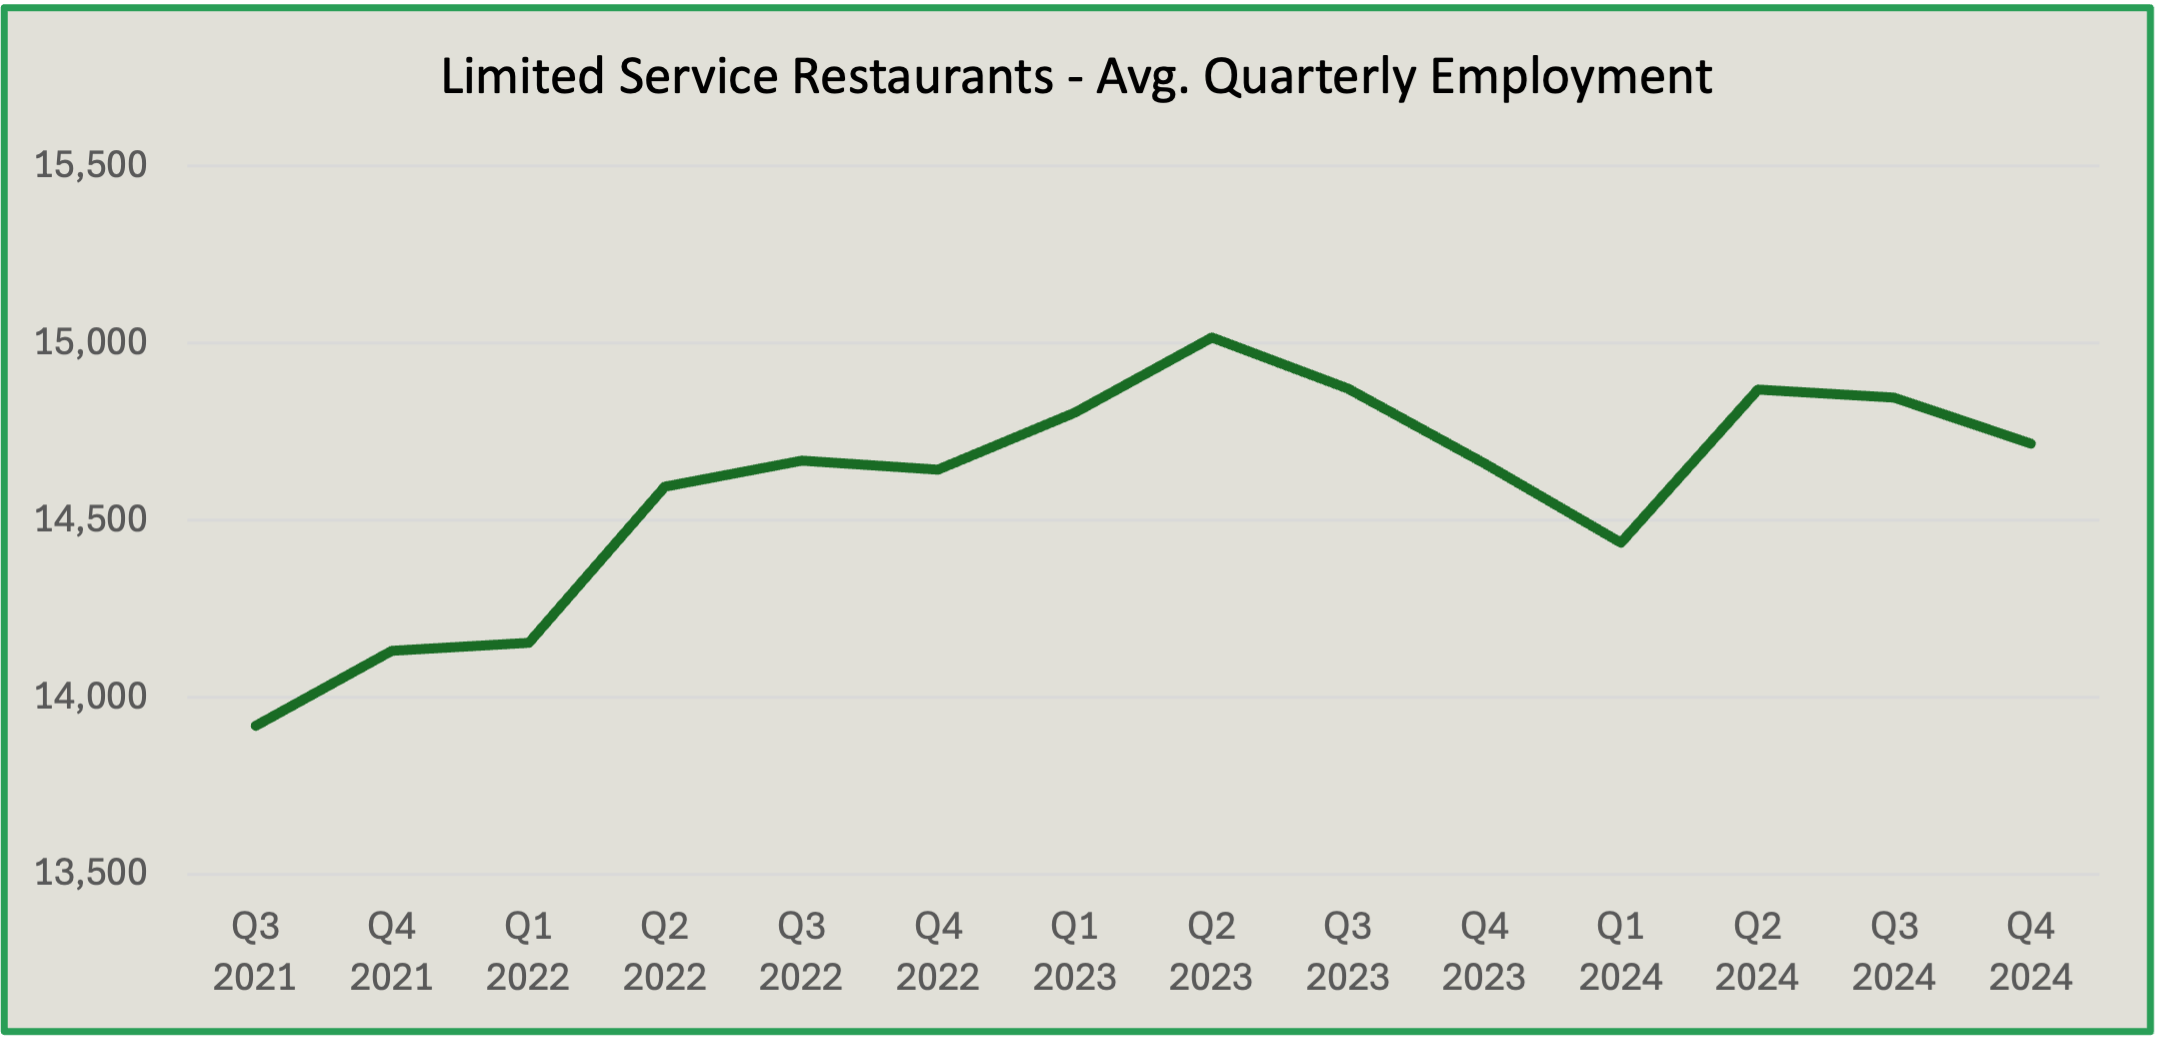
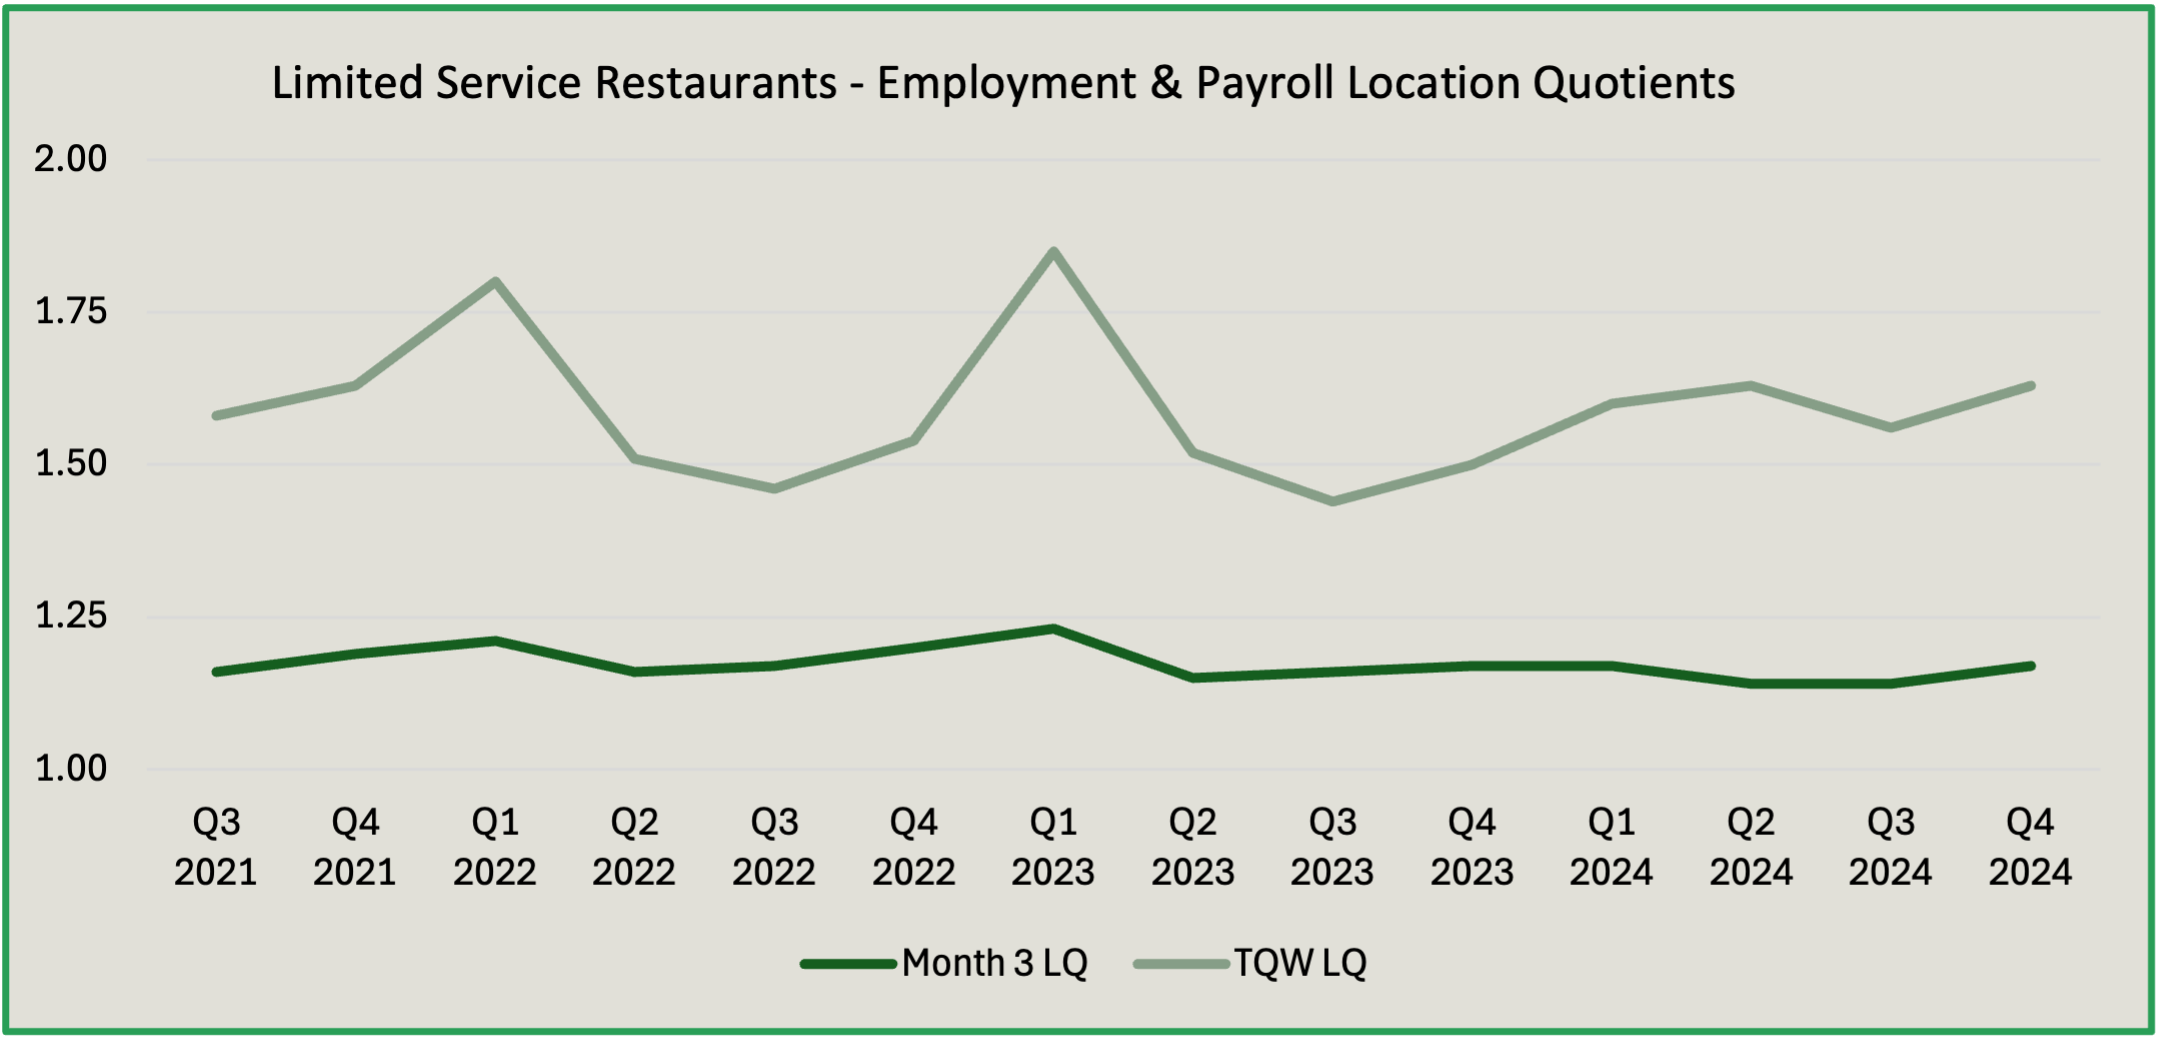
Given the large amount of data involved, I will present my findings by category, first beginning with employment. To remain consistent with the original study, I collected monthly employment data for September, from years 2021 through 2024. In addition, I examined quarterly employment data for Q4 over those same years. As of this writing, the most recently available QCEW data through the U.S. Bureau of Labor Statistics is for Q4 2024. Data for the first quarter of 2025 is set to be released in September. Due to seasonal fluctuations that occur throughout the year, we must only compare data for the same quarter or month year-over-year.
Employment
Between September 2023 and September 2024, Fresno County lost 75 jobs in its limited service restaurants sector, representing a 0.51% decrease in industry employment. By contrast, the state of California lost 15,073 jobs or 2.64% of its fast food workforce over the same time period. The impact this had on U.S. economy was substantial, decreasing overall fast food employment by 0.24% year-over-year, which translated into 11,088 jobs lost. Gains were made in other states that helped offset the total decline.
Prior to the enactment of AB 1228, the limited service restaurants industry was making impressive gains in employment. Between September 2021 and September 2022, industry employment increased by well over 5 percent both statewide and in Fresno County. More modest gains were made the following year, ending in September 2023. While Fresno County’s year-over-year change declined more sharply than was seen at the state or national level, it nevertheless remained in the positive. Much of this accelerated growth between 2021 and 2023 can be attributed to covid-era restrictions ending. The statewide economy fully reopened on June 15th, 2021 which allowed for indoor dining at restaurants again. Over this two-year period, nearly 43,000 fast food jobs were added statewide, with 850 of these added in Fresno County. At the national level, over 309,000 jobs were added for limited service restaurants.
In percentage terms, the share of these new jobs that were erased in the subsequent year was 35.1% at the state level, 8.8% in Fresno County, and 3.6% nationwide. Clearly, Fresno County faired far better than the state overall, despite being subject to the same mandate
Quarterly Averages
As promised, I will also provide this same analysis for the Q4 quarterly average data. This data is slightly more recent and also helps smooth out any monthly fluctuations. Between Q4 2023 and Q4 2024, Fresno County gained 57 jobs in its limited service restaurants sector, representing a 0.39% increase in industry employment. By contrast, the state of California lost 9,338 jobs or 1.65% of its fast food workforce over the same time period. The impact on the U.S. economy was far less substantial, decreasing overall fast food employment by only 0.01% year-over-year, which translated into 237 jobs lost. This more recent quarterly data paints a far better picture across the board, with Fresno County actually experiencing a slight gain in fast food employment since before the mandate was implemented (but after it was enacted).
Employment gains in prior years were smaller than their monthly counterparts, but still significant. Between Q4 2021 and Q4 2022, industry employment increased 4.52% statewide and 3.62% in Fresno County. More modest gains were made the following year, ending in Q4 2023. Fresno County’s year-over-year change declined sharply yet again, but still managed to remain in the positive. During the two-year period from Q4 2021 to Q4 2023, over 33,000 fast food jobs were added statewide, with 529 of these added in Fresno County. At the national level, nearly 256,000 jobs were added for limited service restaurants.
In percentage terms, the share of these new jobs that were erased in the subsequent year was 28.0% at the state level and 0.09% nationwide, whereas Fresno County saw an additional gain of 10.8%.
Establishments
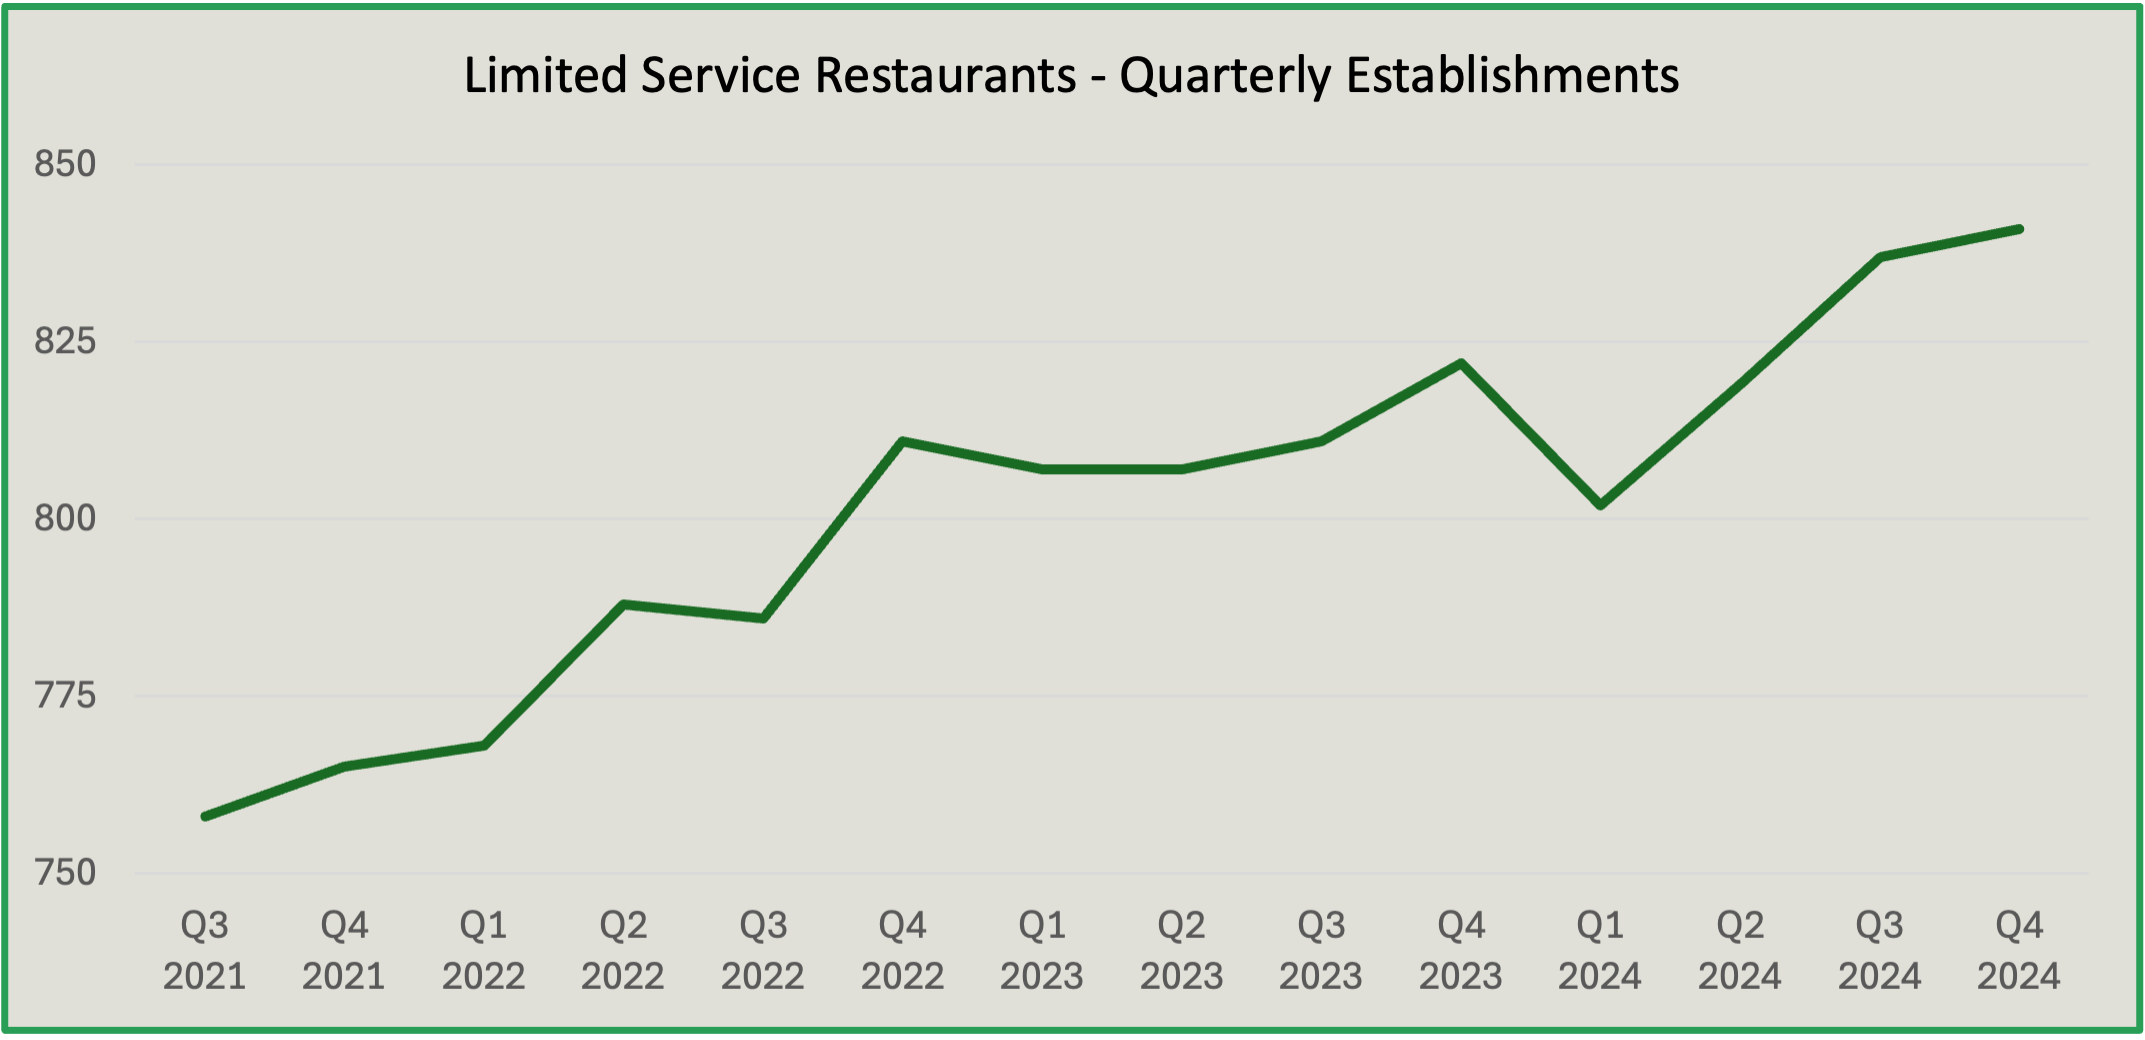
One metric the aforementioned study did not track was the number of fast food establishments and to what extent it was impacted by this wage mandate. According to QCEW data, the number of establishments in the limited service restaurant industry has increased every year since Q4 2021. Granted, statewide growth has slowed down since the mandate was enacted. But perhaps the most interesting observation in this particular dataset is that the number of fast food establishments in Fresno County increased by a greater percentage year-over-year after the mandate was enacted, compared to the year before it was enacted. This deviated from the straight downward trend seen in the statewide and nationwide aggregates. Between Q4 2021 and Q4 2024, 76 new fast food establishments opened in Fresno County, marking a 9.9% increase. Statewide, 2,143 new establishments opened — marking a 6.7% increase. Finally, 13,569 new establishments opened nationwide, marking a 5.3% increase.
Total Quarterly Wages (TQW)
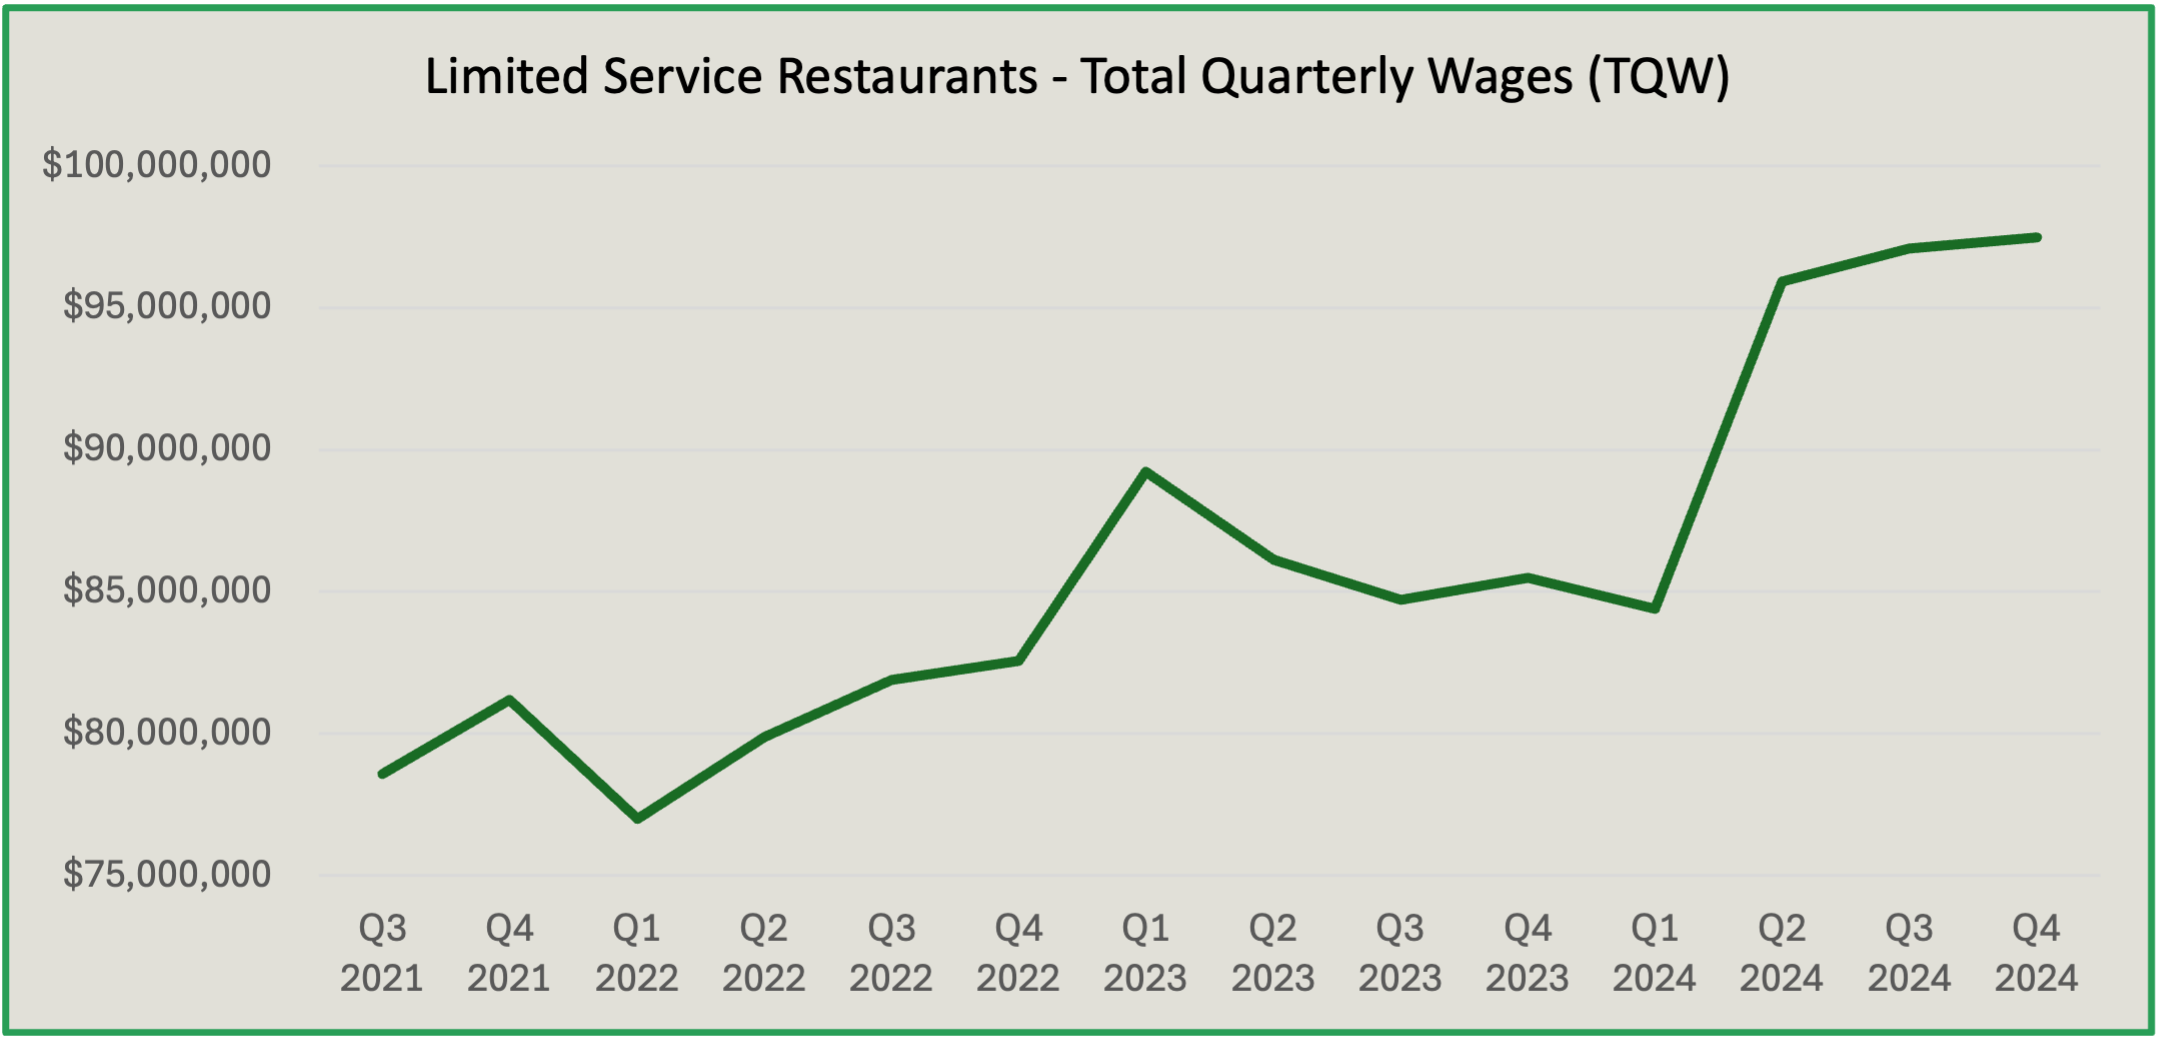
A number of factors go into calculating total quarterly wages, which represents the total payroll for a given industry each quarter. An increase in employment, number of establishments, and minimum wages can all contribute to a rise in total payrolls, whether those effects are combined or observed separately. The main question we need to answer is, despite a decrease in fast food employment in the most recent observation year, did total payrolls rise or fall? Unsurprisingly, total payrolls increased substantially between Q4 2023 and Q4 2024, especially in Fresno County which saw a 14.0% year-over-year increase. Statewide, this number drops to 9.0%, and down to 6.2% nationally. With a 25% increase in the minimum wage, we expected to see a outsized impact on total payrolls, regardless of whether sector employment went up or down. But why did Fresno County experience a larger increase in fast food payrolls than California as a whole? The answer is threefold:
(1) Despite some job losses, Fresno County retained more of its fast food workforce than California overall.
(2) The number of fast food establishments increased by a larger percentage in Fresno County than it did in California overall.
(3) Average weekly wages increased by a larger percentage in Fresno County than they did in California overall, which is a perfect segue into the next section.
Average Weekly Wages
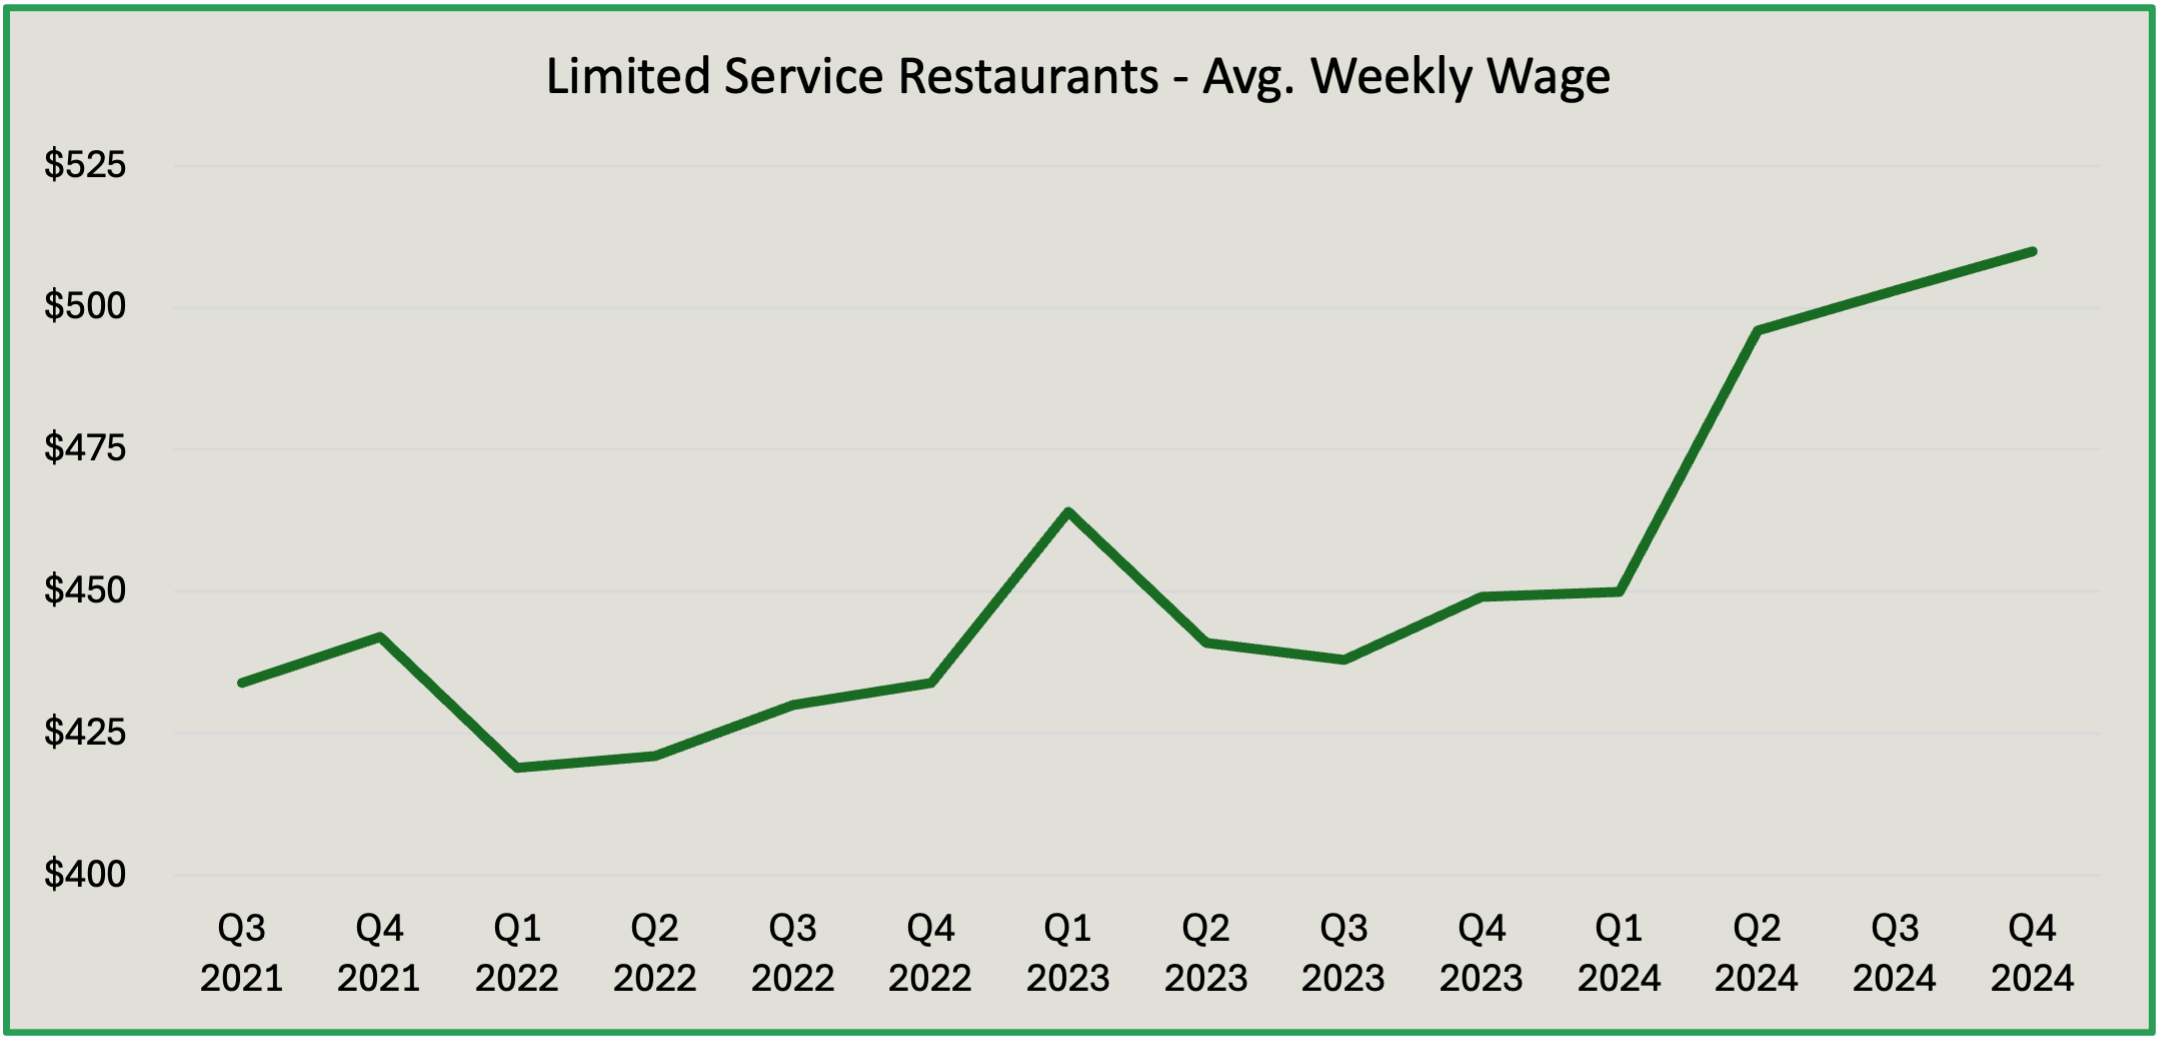
For simplicity’s sake, the percentage figures presented here are based on the QCEW data expressed in nominal terms. Of the three geographies examined here, Fresno County saw the largest increase in average weekly wages year-over-year, measuring in at 13.6% from Q4 2023 to Q4 2024. Statewide, average weekly wages in the fast food sector increased by 10.7%, and nationwide, by 6.1%. It is clear that AB 1228 has had a greater impact on Fresno County wages than California overall. This is because many of the state’s largest population centers had already imposed higher minimum wages than the statewide baseline of $16 per hour, leaving less room to grow. Neither the County of Fresno or any of its municipalities have imposed a wage floor higher than the statewide requirement. More than half of states raised their minimum wages following the passage of AB 1228, which also contributed to a substantial year-over-year increase at the national level.
In Q4 2024, the average weekly wage for a limited service restaurant employee in Fresno County was $510, up from $449 the previous year. Statewide, the average weekly wage was $588, up from $531 the previous year. Nationwide, the average weekly wage drops down to $472, which was still up from $445 the previous year. As of Q4 2024, fast food sector wages were 13.3% less in Fresno County compared to the statewide average, and 8.1% more than the nationwide average.
It is worth mentioning the consumer price index (CPI) increased by 2.72% between Q4 2023 and Q4 2024. Therefore, nominal increases in average weekly wages year-over-year have far outpaced the rate of inflation. This wasn’t always the case. In our first observation year, between Q4 2021 and Q4 2022, the rate of inflation was 7.10% while average weekly wages decreased year-over-year in both Fresno County and California.
Conclusion
The two main takeaways from this data are as follows:
(1) From an employment standpoint, Fresno County has been less impacted by AB 1228 than California overall. Depending on the time frame being examined, job losses are minimal or nonexistent. Between Q4 2023 and Q4 2024, fast food employment increased in Fresno County where it declined both statewide and nationwide. Moreover, business growth in the limited service restaurant industry has sped up in Fresno County where it has slowed down both statewide and nationwide.
(2) The passage of AB 1228 has had a larger effect on total payrolls and average weekly wages in Fresno County, where these metrics have increased ~13 — 14% year-over-year, far surpassing increases seen at both the statewide and national level. This is primarily because Fresno County or any of its municipalities had not imposed a higher minimum wage than required by the state, prior to the passage of 1228, whereas many of California’s major population centers had already. This meant the effective minimum wage increase for many fast food employees was less than 25%, resulting in less impact on payrolls and average wages than would be seen in baseline-wage cities and counties.
Source Notes
All data cited in this article was collected from the U.S. Bureau of Labor Statistics, Quarterly Census of Employment & Wages (QCEW). Limited Service Restaurants, defined by NAICS code 722513 is used to provide a general representation of fast food restaurants. Not all limited service restaurants are fast food restaurants, as this definition includes establishments such as cafes, delis, diners, and pizza parlors. A complete definition of NAICS code 722513 can be found here. Furthermore, not all fast food establishments are subject to the provisions of AB 1228, such as those with 60 or less locations nationwide. The original study by the National Bureau of Economic Research can also be found here.
Future Research
My next project will be examining the effect of AB 1228 on full service restaurants in Fresno County. While the mandate didn’t explicitly affect wages for this industry, it is possible that competition in the labor market has shifted some employees between sectors, or even caused an increase in average wages in full service, to more closely match those now seen in the limited service restaurant industry. Additionally, once data for Q1 2025 becomes available I will be providing updated figures to supplement this article. Until then, look out for a consolidated dataset on our Explore Data page which will include the figures referenced in this article. If you made it this far, thank you for reading. Stay tuned for more “in the weeds” research related to all things Fresno County.
Appendix
This section includes graphs constructed from the QCEW data for Fresno County, pertaining to various industry metrics.